Taxonomic Tree Visualization and Nested List Parsing

I’m currently employed by WWU’s biology department to develop a web application that catalogues over 1000 moth species native to the Pacific Northwest region. With so many species, the taxonomic tree is large and not readily displayable on the web. Coming up with an intuitive user interface for navigating the tree is proving to be an interesting challenge.
Visualization Techniques
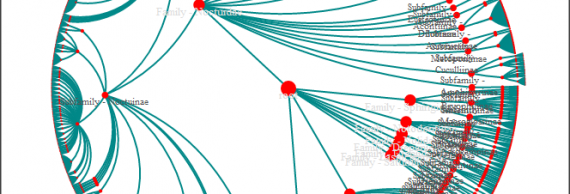
After some research, two tree visualization techniques seemed like they might work: HyperTrees and SpaceTrees. Conveniently, there is an awesome library called The JavaScript InfoVis Toolkit that can visualize data with both these techniques. Before I could visualize our data, I had to convert it to a format JIT can understand.
Nested List Parsing
My source data were the nested lists that django-cms created from our taxonomic hierarchy. Using Python, BeautifulSoup (an HTML parser), and our django generated HTML I came up with the following script which converts nested, unordered lists to a data structure accepted by JIT.
2
3
4
5
6
7
8
9
10
11
12
13
14
15
16
17
18
19
20
21
22
23
24
25
26
27
28
29
30
31
def recursive_list_traversal(d, tab_level):
if(d == None):
return "[],\n"
else:
d = d.li
tabs = ''.join(['\t' for i in xrange(tab_level)])
string = " [\n"
siblings = d.findNextSiblings()
siblings.insert(0,d)
for sib in siblings:
string += tabs + '{\n' + tabs + 'id: "' + str(hash(sib.a.string)) + '",\n' + tabs + 'name: "' + sib.a.string + '",\n' + tabs + 'data: {},\n' + tabs + 'children:'
string += recursive_list_traversal(sib.ul, tab_level+1);
string += tabs + '},\n'
string += tabs + "]\n"
return string
html = open('page.html', 'r').read()
soup = BeautifulSoup(html)
f = open('taxonomy.json', 'w')
f.write('var json = {\n\tid: "root",\n\tname: "root",\n\tdata: {},\n\tchildren:')
taxonomy = soup.find("ol", id="taxonomy")
f.write(recursive_list_traversal(taxonomy, 2))
f.write('};')
f.close()
You end up with a JSON structure as follows (I’ve truncated it for posting).
2
3
4
5
6
7
8
9
10
11
12
13
14
15
16
17
18
19
20
21
22
23
24
25
26
27
28
"data": "root",
"children": [
{
"data": "Family - Drepanidae",
"children": [
{
"data": "Subfamily - Thyatirinae",
"children": [
{
"data": "Habrosyne",
"children": [
{
"data": "Habrosyne scripta",
"children":[],
},
]
},
{
"data": "Pseudothyatira",
"children": [
{
"data": "Pseudothyatira cymatophoroides",
"children":[],
},
]
},
// Truncated...
Visualizations
Without further ado, the (very) rough visualizations I put together. (NOTE: They suffer when confined to the small column width of my blog)
HyperTree
SpaceTree
The SpaceTree is the clear winner and provides a wonderfully clear way of navigating through a large taxonomic tree. I’m looking forward to polishing up the visualization and adding a variety of navigation features.
Further Reading
JavaScript InfoVis Toolkit
University of Maryland Paper on the SpaceTree [PDF]